
gary-kerkin.ip-ddns.com: the ruminations of an octogenarian

Lest anyone think that I may have cheated by using AI, they should examine the 157 references listed at the end and consider whether I, as an octogenarian, would have the time, patience, and perseverance to undertake the scope I set for Gemini. Perhaps I could have, but it would have taken me much longer than the few hours it has taken me to review and edit the output. In the right hands, AI could be the greatest benefit mankind has yet encountered!
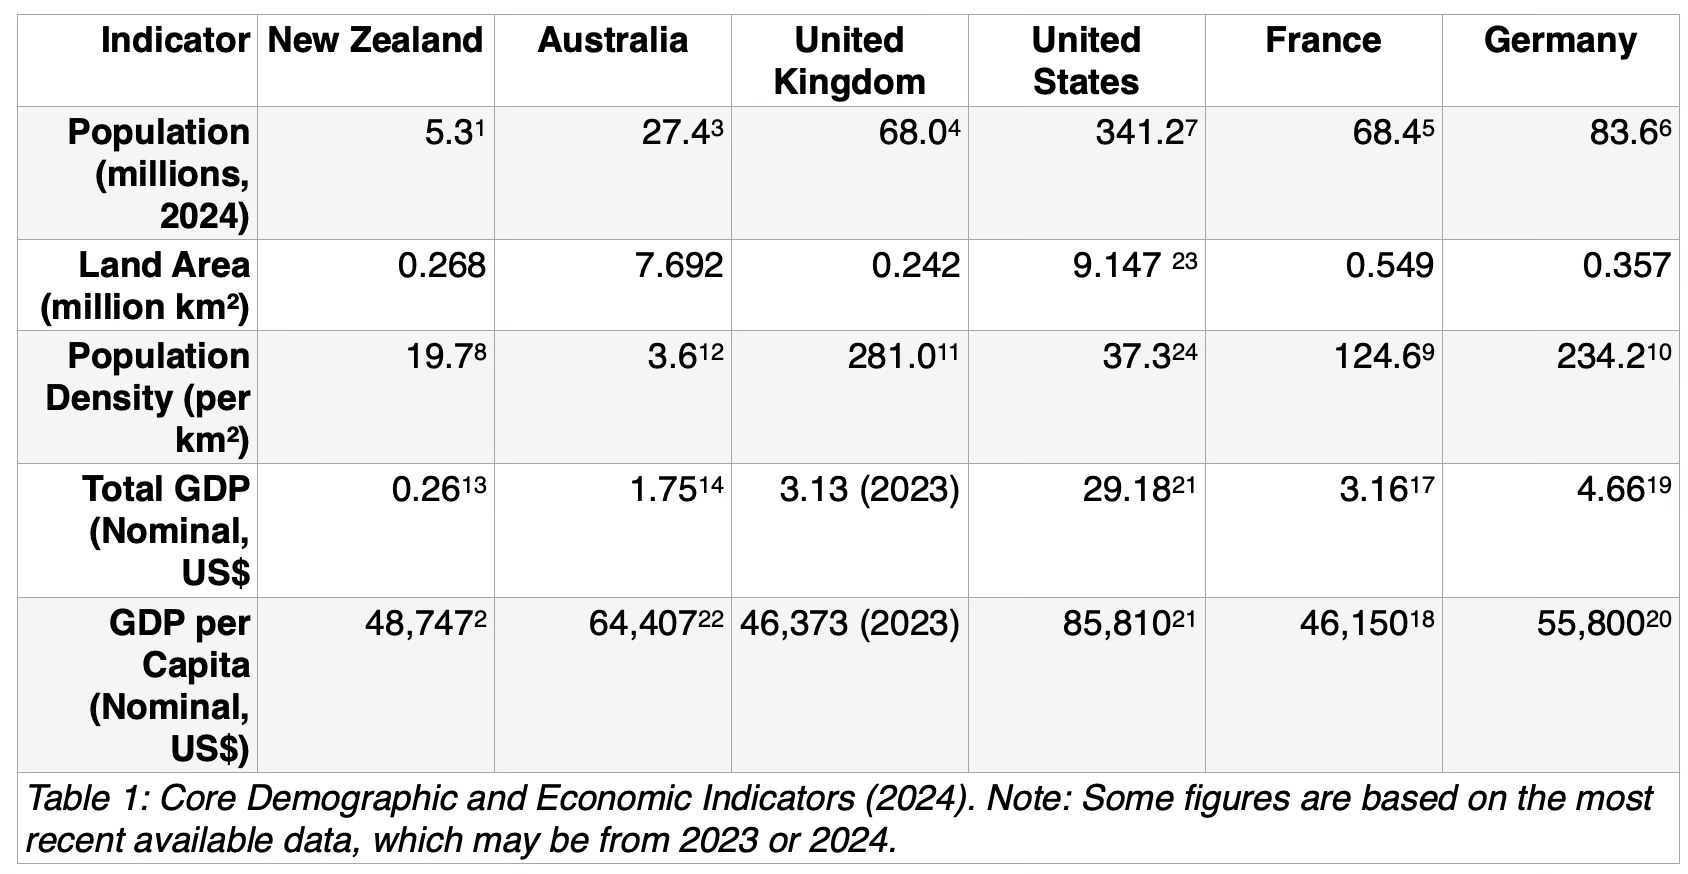
Note that the figures researched in this report pre-date the recent uncertainty in international tariffs or the present government policies.Any meaningful analysis of a nation‘s economic and social characteristics must begin with an understanding of its fundamental scale. For New Zealand, this consideration is important. Compared to major developed nations, New Zealand operates with a different demography and economy—not just as a matter of degree but rather of orders of magnitude which creates a gulf between its unique advantages and its structural, economic challenges.
As of 2024, New Zealand‘s population stood at approximately 5.3 million people1,2. This figure is dwarfed by its closest neighbour, Australia, with 27.4 million people3, and is a small fraction of the populations of the UK (68.0 million), France (68.4 million), Germany (83.6 million), and the United States (341.2 million)4,5,6,7. This small population is spread across a landmass that, while not vast, results in a very low population density of around 19.7 people per square kilometre8. This is in stark contrast to the densely populated European nations such as Germany (237 people/km²) and the UK, where England‘s density reaches an intense 434 people/km² 9,10,11. While Australia‘s overall density is exceptionally low at 3.6 people/km², this figure is geographically misleading, as over 85% of its population is concentrated in a narrow coastal strip, creating urban densities comparable to other developed nations12.
This demography directly translates to economics. New Zealand‘s nominal Gross Domestic Product (GDP) of approximately NZ$440 billion13 is eclipsed by the economic output of its peers. Australia′s economy is nearly seven times larger at NZ$2.95 trillion14, while the economies of France (NZ$5.33 trillion), the UK (est. NZ$6.70 trillion), Germany (NZ$7.87 trillion), and the United States (NZ$47.57 trillion) are larger by factors of 12, 15, 18, and 108, respectively15,16,17.
However, this disparity in national economic power does not fully translate to individual poverty. When compared on a per-capita basis, a more accurate picture emerges, revealing a key paradox in New Zealand‘s economic identity. With a GDP per capita of approximately NZ$82,2852, New Zealand provides a level of individual prosperity comparable to France (NZ$77,901)18, and not very far from that of Germany (NZ$94,190)19,20.
It does, however, lag significantly behind Australia (NZ$108,719) and the United States (NZ$144,848)21. This creates a fundamental tension: New Zealand‘s citizens enjoy a high-income standard of living and expect first-world public services, yet the state must fund these expectations from a national economic base that is much smaller. Large-scale national investments in infrastructure, defence, or research and development inevitably consume a much larger proportion of the national budget than in larger countries, creating persistent fiscal and political pressures.
General cost-of-living indices present a nuanced starting point. Data from 2024 indicates that New Zealand‘s overall cost of living is comparable to other OECD nations, ranking as more affordable than major hubs in Australia, the US, and the UK, but more expensive than Germany25. However, such aggregate indices can mask significant variations in specific categories, particularly for goods sensitive to import costs and local market competition.
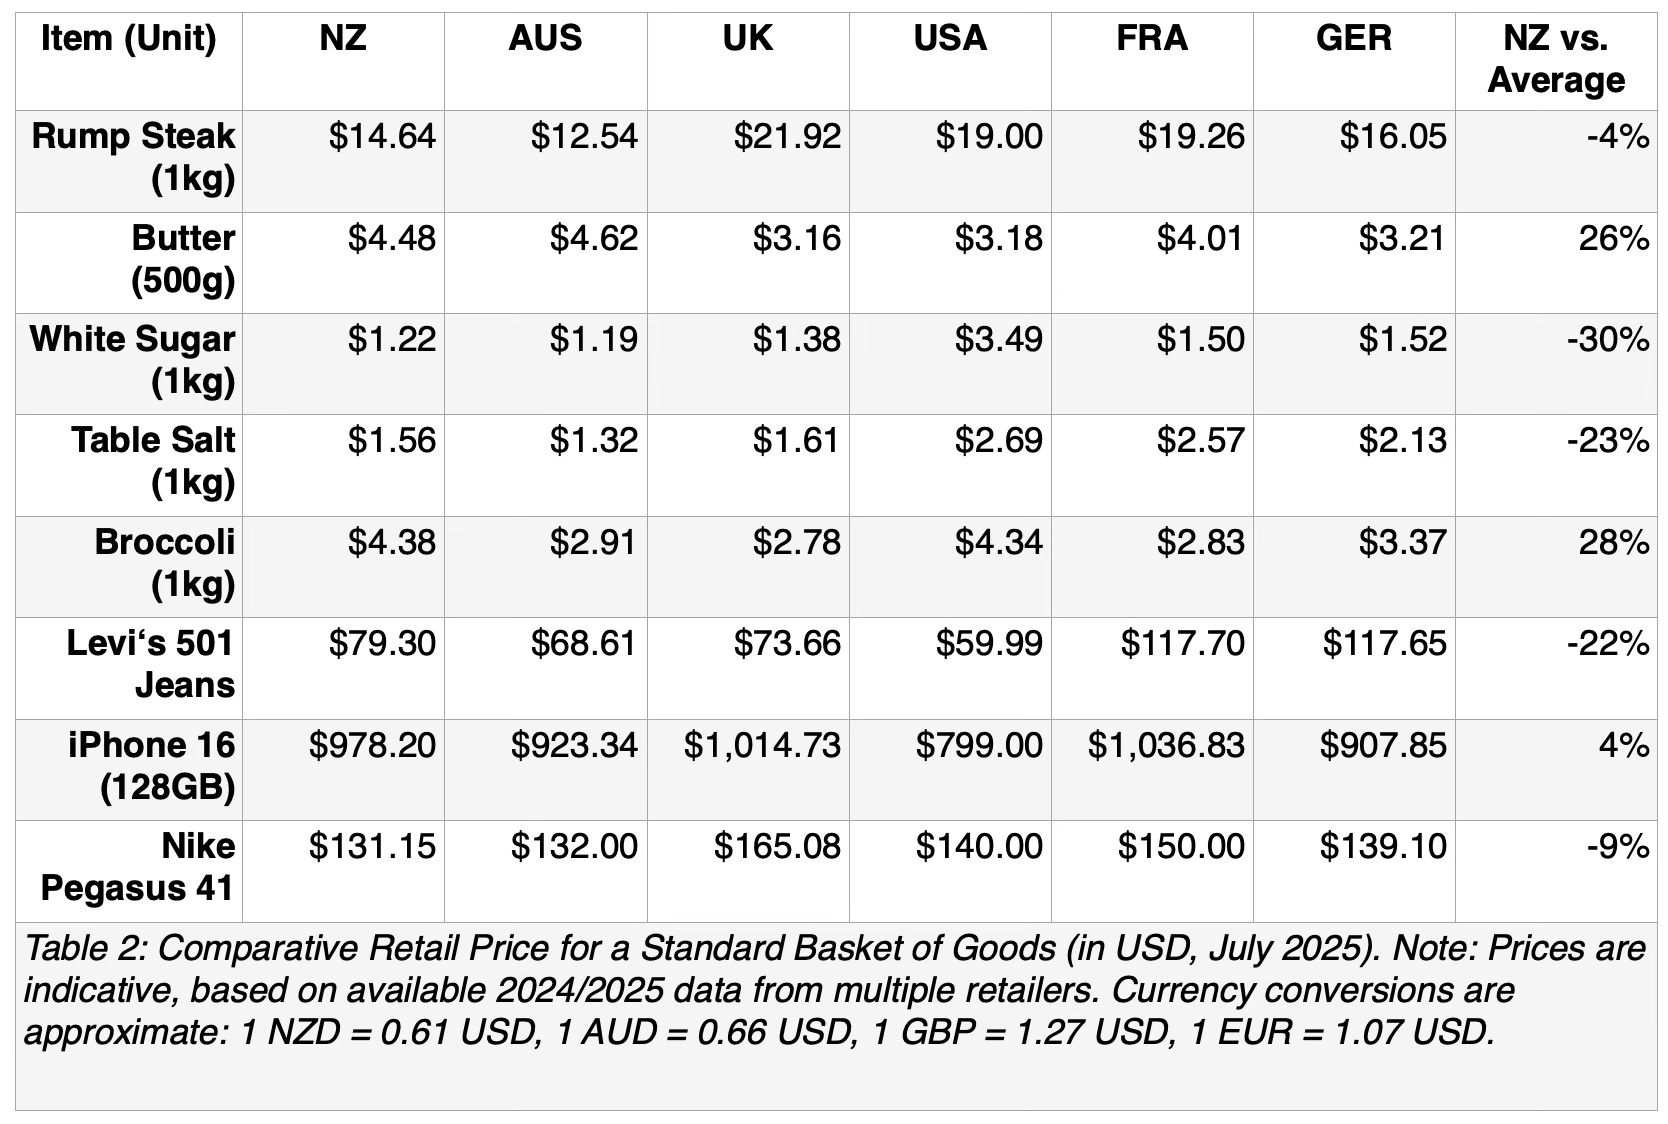
The most telling disparities appear in the food category. A striking paradox emerges with butter: despite being one of the world‘s most efficient dairy producers, New Zealand consumers pay a 26% premium compared to the average of these five other wealthy nations.40,41 The price is comparable to that in Australia, another major agricultural producer, but significantly higher than in the UK or USA. This suggests the structure of the domestic market, which lacks competition, and the scale of internal distribution networks can inflate prices for locally produced goods. A similar pattern is seen with fresh produce like broccoli, where New Zealand prices are among the highest. Conversely, for a commodity like sugar, New Zealand prices are very competitive, undercutting even major producers like the US and France.42,43,44,45,46,47
Geographic Isolation and Supply Chain Costs: New Zealand‘s primary disadvantage is its remoteness. It sits at the end of long, complex global supply chains, adding significant time and cost to imports48. Shipping from Europe or the US is inherently more expensive than shipping to neighbouring countries49. This distance premium affects everything from vehicles to consumer electronics. Furthermore, this isolation creates vulnerability. Disruptions at key Asian shipping hubs like Singapore and Shanghai have direct, cascading effects on the availability and price of goods in New Zealand, a weakness that was exposed during the COVID-19 pandemic50.
Economies of Scale and Market Competition: A small domestic market of 5.3 million people cannot support the same level of competition or achieve the same economies of scale as markets ten or sixty times its size. A New Zealand Treasury paper identifies this lack of scale as a key factor contributing to higher prices51,52,53. Importers bring in smaller volumes, leading to higher per-unit shipping and overhead costs. Domestically, fewer producers and retailers can lead to a less competitive environment, which encourages higher profit margins. This is evident in the limited variety of certain products, such as new car models, where Australia offers a significantly wider range of brands and models to a larger population54,55,56.
Import Tariffs: While often blamed for high prices, formal trade barriers are not the primary culprit. New Zealand‘s weighted mean tariff rate of 1.70% is low by international standards and comparable to the USA (1.49%) and Australia (0.99%)57,58,59. The European Union‘s common external tariff is similar at 1.33%60. This indicates that New Zealand‘s high consumer prices are driven more by the structural factors of geography and market size than by protectionist trade policies.
In a notable counter-trend, New Zealand has invested heavily in its digital infrastructure to overcome its physical isolation. Its median fixed broadband speed of 174.64 Mbps surpasses that of Australia (79.18 Mbps) and the UK (131.77 Mbps) and is competitive globally61. Furthermore, mobile data costs for low-usage plans are cheaper than in Australia, the UK, and the USA62. This suggests a strategic effort to mitigate the disadvantages of physical distance by fostering strong digital connectivity, though challenges in bridging the rural-urban digital divide persist63.
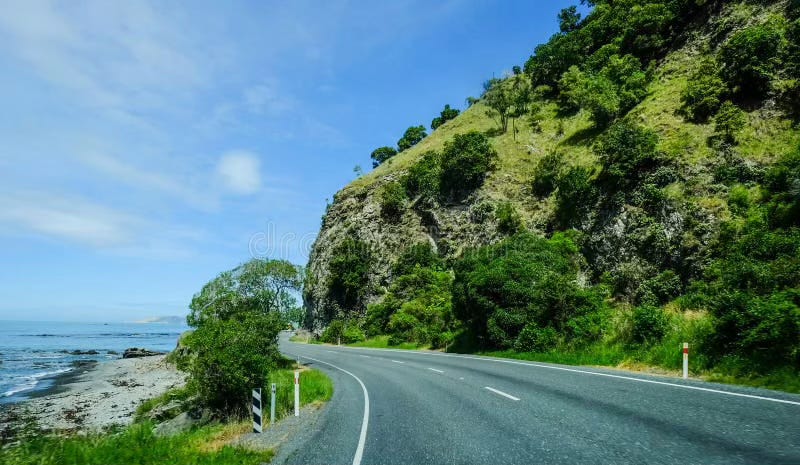
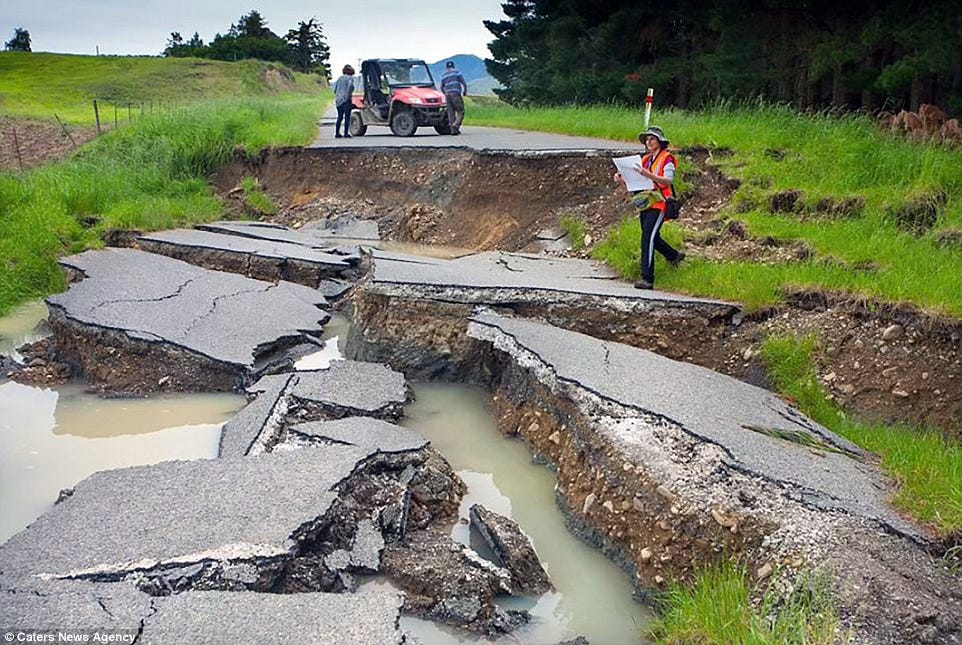
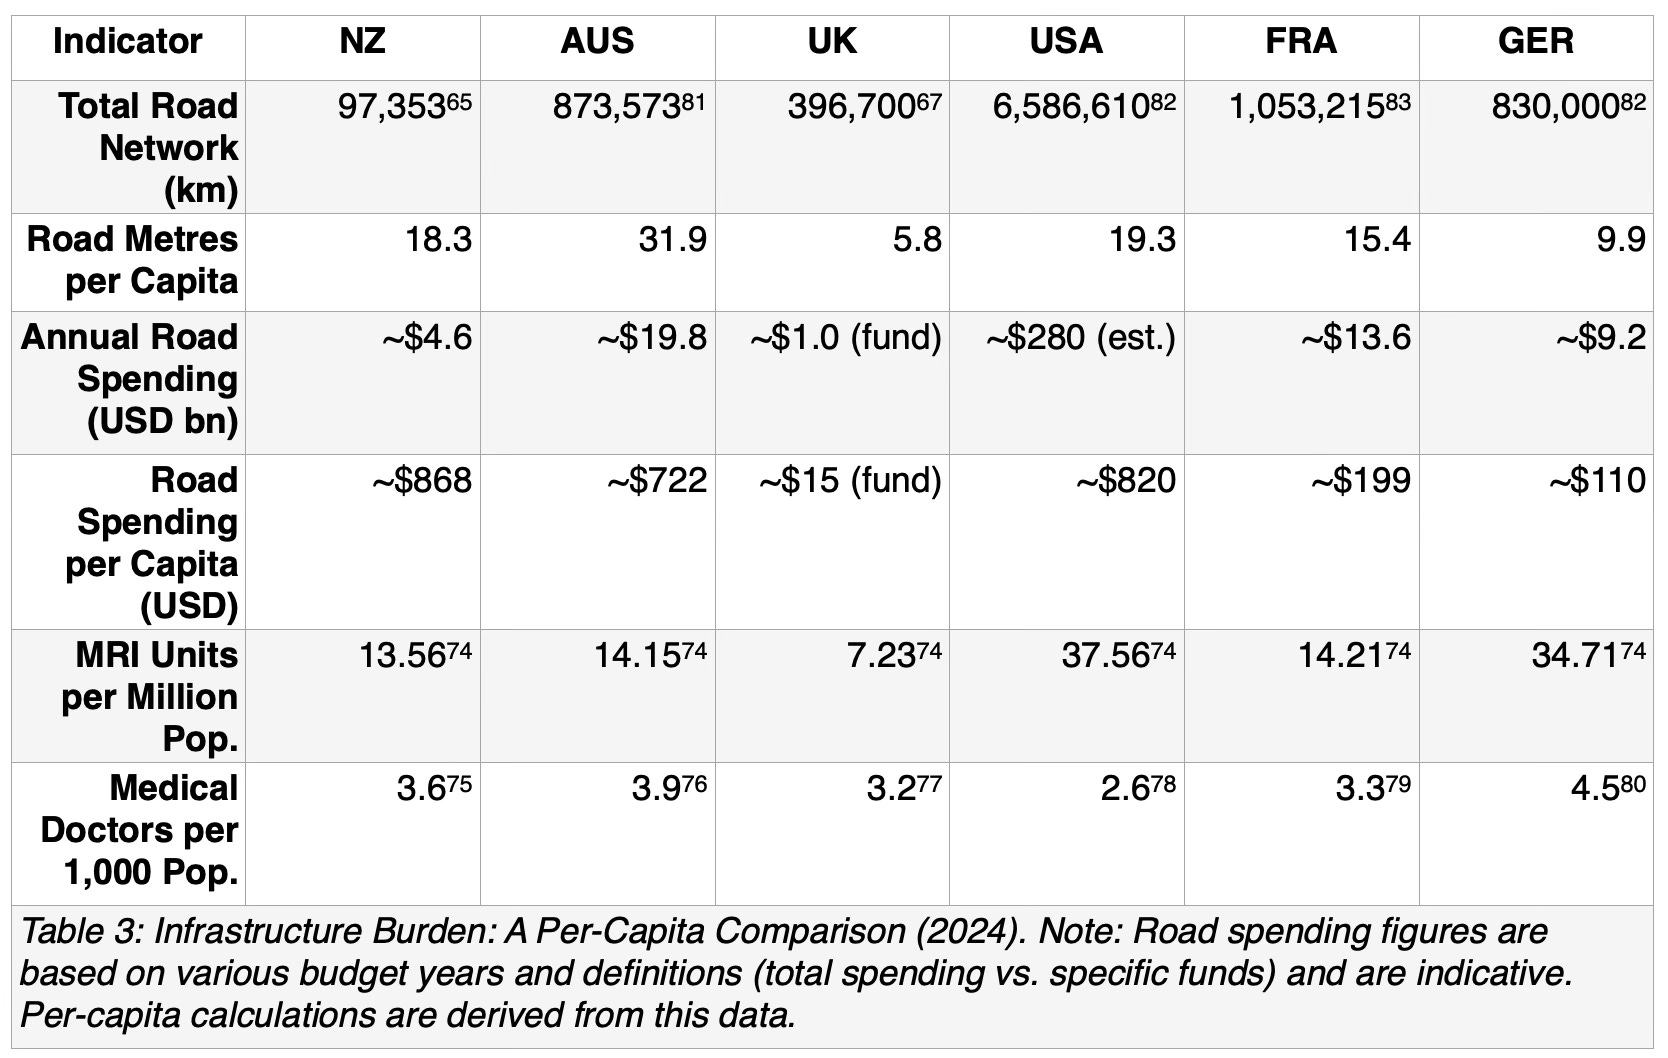
The challenge is starkly illustrated by the national road network. New Zealand maintains approximately 97,000 km of roads to serve its 5.3 million people.65 This equates to roughly 18.3 meters of road for every resident66. Contrast this with the United Kingdom which maintains a network of about 397,000 km for 68 million people i.e. only 5.8 meters of road per person.67,68 Each New Zealander is therefore responsible for funding over three times the length of road as their British counterpart. This "tyranny of internal distance" means that the cost of maintenance and upgrades is a heavy but unavoidable fiscal burden.
In the 2023/24 fiscal year, New Zealand invested NZ$7.5 billion (approximately US$4.6 billion) into its National Land Transport Programme, a significant portion of which was dedicated to maintenance69. While this figure is smaller than the spending in larger nations—Australia‘s governments spend around AU$30 billion (US19.8 billion) annually, and Germany planned investment of €8.65 billion (US$9.25 billion) in 2021—the per-capita cost is substantial70,71. Australia′s average per−capita infrastructure spending (across all types) is AU$9,694 over four years, highlighting the immense capital required to service a large, sparsely populated continent72. The financial strain in New Zealand is a direct consequence of spreading the cost of a geographically extensive network across a small tax base, a problem which is amplified in remote and rural communities.
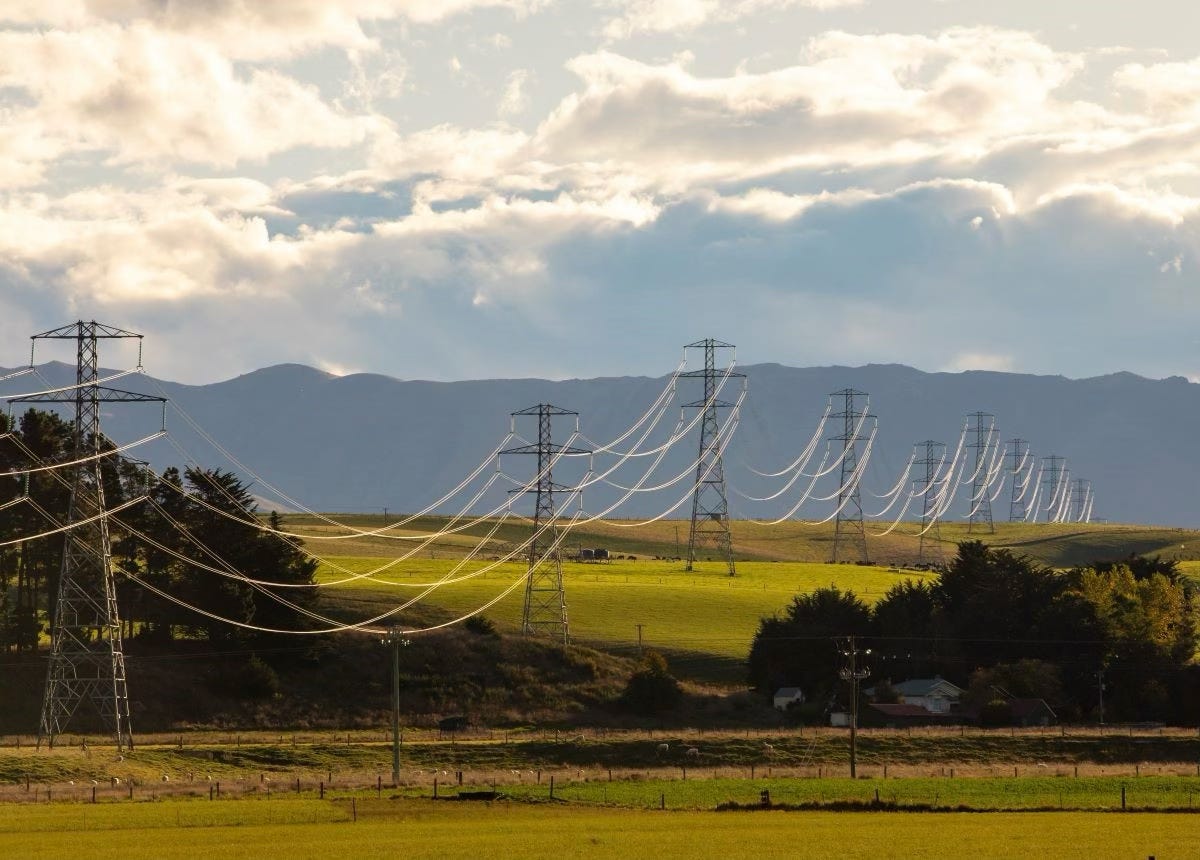
The same principle of a high per-capita burden applies to other national utilities. Upgrading New Zealand‘s “Three Waters” infrastructure (drinking water, wastewater, and stormwater) is estimated to require up to NZ$185 billion over the next 30 years. Spreading this cost over the current population would result in extremely high household bills, demonstrating the financial challenge of modernising essential services at a small national scale. Similarly, strengthening the national electricity grid involves projects costing hundreds of millions of dollars, such as the approved NZ$393 million investment in grid upgrades, including a NZ$103 million project for the Cook Strait electricity cable connecting the two main islands73.
This fiscal pressure necessitates strategic compromises in the provision of capital-intensive public services like healthcare. An analysis of specialised medical infrastructure reveals that New Zealand often occupies a middle ground, unable to afford the density of the wealthiest large nations but maintaining a standard above others. For example consider Magnetic Resonance Imaging (MRI) machines per million people. New Zealand with 13.56 is well behind the capital-rich systems of Germany (34.71) and the USA (37.56)74, but is nearly double the capacity of England (7.23). A similar pattern exists for the density of medical doctors. With 3.6 doctors per 1,000 people, New Zealand is better staffed than the UK (3.2) and the USA (2.6) but has fewer physicians per capita than Germany (4.5) and Australia (3.9)75,76,77,78,79.

A nation‘s tax structure is a reflection of its economic realities and social priorities. For New Zealand, the fiscal framework must contend with the core challenge of funding first-world public services from a small population and economic base. While its tax system is broadly similar in design to its larger peers—relying on progressive income taxes and consumption-based levies—the constraints imposed by its scale dictates the burden on individuals and the necessity of certain revenue streams.
New Zealand uses a progressive income tax system, with rates in 2024 ranging from 10.5% on income up to NZ$15,600 to a top rate of 39.1%87. This structure is comparable to that of other nations in this analysis, all of which use a similar tiered approach.
Australia features a tax-free threshold up to AU$18,200, with rates rising to 45% at AU$180,000, supplemented by a 2% Medicare levy88.
The United Kingdom has a basic rate of 20%, a higher rate of 40%, and an additional rate of 45%89.
The United States federal system has seven brackets, starting at 10% and rising to a top marginal rate of 37% for income over US$609,350 for single filers90.
France offers a tax-free threshold up to €11,294, with rates progressing to a top band of 45% for income over €177,10691.
Germany also has a tax-free threshold (up to €11,604), after which a complex progressive formula applies, with rates ranging from 14% to a top rate of 42%92.
While the rate structures are analogous, the total revenue generated is vastly different due to the population and economic scale disparities. To fund its high per-capita infrastructure costs and comprehensive social services, New Zealand must extract sufficient revenue from a much smaller pool of taxpayers. This reality places significant pressure on the existing tax base and makes the system highly sensitive to economic downturns and shifts in high-income earner demographics.
Given the immense per-capita cost of maintaining its extensive road network, New Zealand, like Australia, relies heavily on “user-pays” principles through fuel taxes and road user charges which is not merely a policy preference but a fiscal necessity. A small tax base cannot fund a large infrastructure footprint through general taxation alone without imposing high income or corporate tax rates.
Australia levies a fuel excise of 51.6 cents per litre, with a clear public expectation that these funds be reinvested into the land transport network93.
The United Kingdom‘s Vehicle Excise Duty (VED) is a significant revenue source, raising a forecast £9.1 billion in 2025-26 through a system based on CO₂ emissions and vehicle value94.
The United States has a comparatively low federal gas tax of 18.4 cents per gallon (approximately 4.9 cents per litre), reflecting a different funding model and a much larger vehicle fleet over which to spread costs95.
France and Germany both employ vehicle taxes linked to environmental performance, with rates based on CO₂ emissions and engine displacement, aligning their fiscal policy with climate objectives96,97.
In the realm of international trade, New Zealand‘s low average import tariff rate of 1.70% reinforces its commitment to free trade57. This rate is similar to that of the US (1.49%) and Australia (0.99%) and indicates that the government does not rely heavily on duties as a source of revenue, choosing instead to prioritise lower costs for imported goods for consumers and businesses58.
The COVID-19 pandemic triggered an unprecedented global fiscal response, compelling governments to borrow heavily to fund public health measures, support businesses, and provide household income relief145. This necessary intervention led to a sharp and significant increase in public debt across all developed nations, altering the fiscal landscape for the foreseeable future146. For a small economy like New Zealand, which entered the crisis with a relatively low level of debt, the scale of this new liability is particularly noteworthy when compared to its larger peers.
The economic support during the pandemic led to increased budget deficits and a surge in government debt to levels not seen in decades148. In New Zealand, the total cost of the pandemic response was estimated at $66 billion over the 2020-2026 financial years, equivalent to over 20% of GDP149. This spending caused New Zealand's net debt to rise from 9.3% of GDP in 2019 to 21.5% by 2023.
Table 4 provides a comparative snapshot of the fiscal impact on New Zealand and the other nations in this analysis, highlighting the change in debt-to-GDP ratios and the resulting debt burden per citizen.
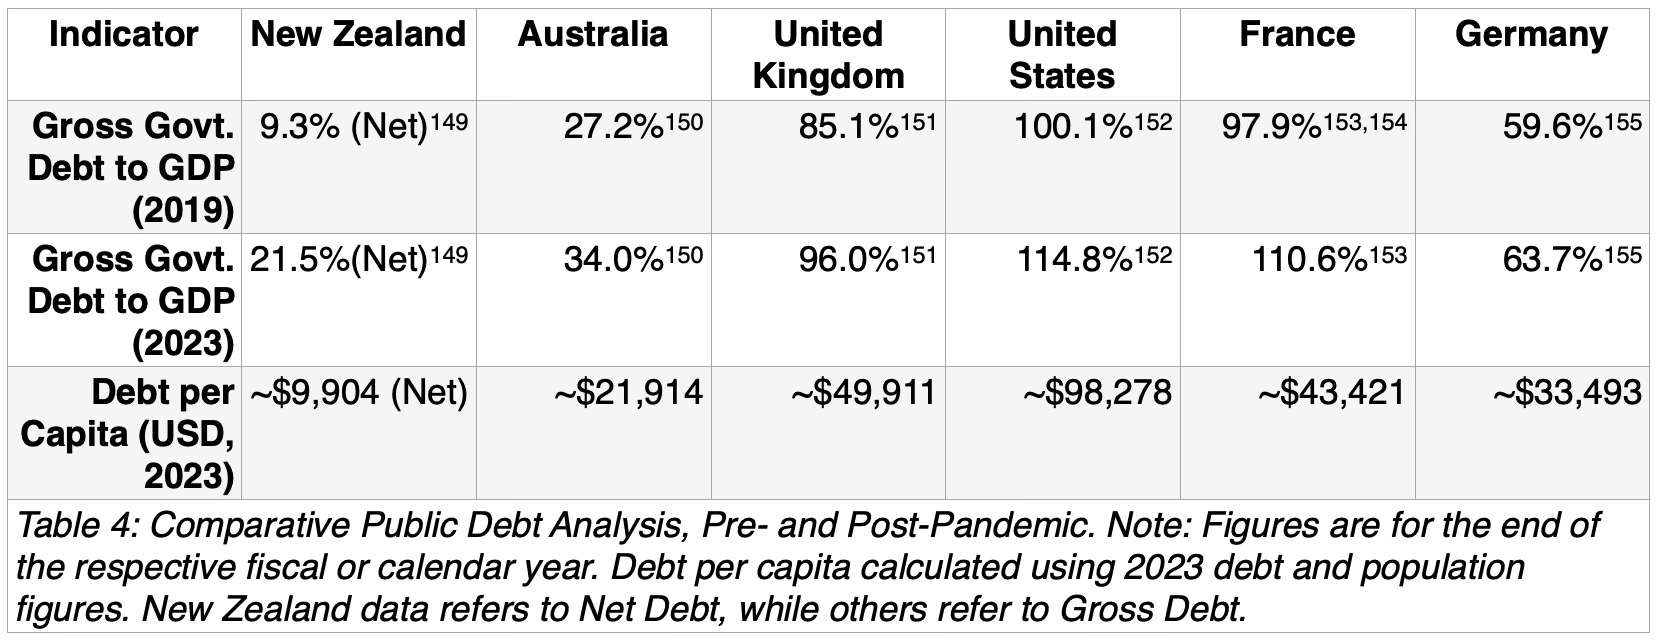
The legacy of higher debt reduces a nation's capacity to respond to future shocks and places long-term pressure on public finances, as a greater portion of government revenue must be allocated to servicing interest payments. For a small country like New Zealand, this fiscal constraint is a critical factor that will shape economic policy and public spending priorities for years to come.
Beyond macroeconomic indicators and fiscal structures, the advantages and disadvantages of a nation‘s population scale are manifest in its social fabric. New Zealand presents a compelling paradox: it offers a quality of life that is among the best in the world, characterised by safety, trust, and access to nature. Yet, this idyllic image coexists with significant economic inequality and wealth concentration that matches or even exceeds that of its larger peers.
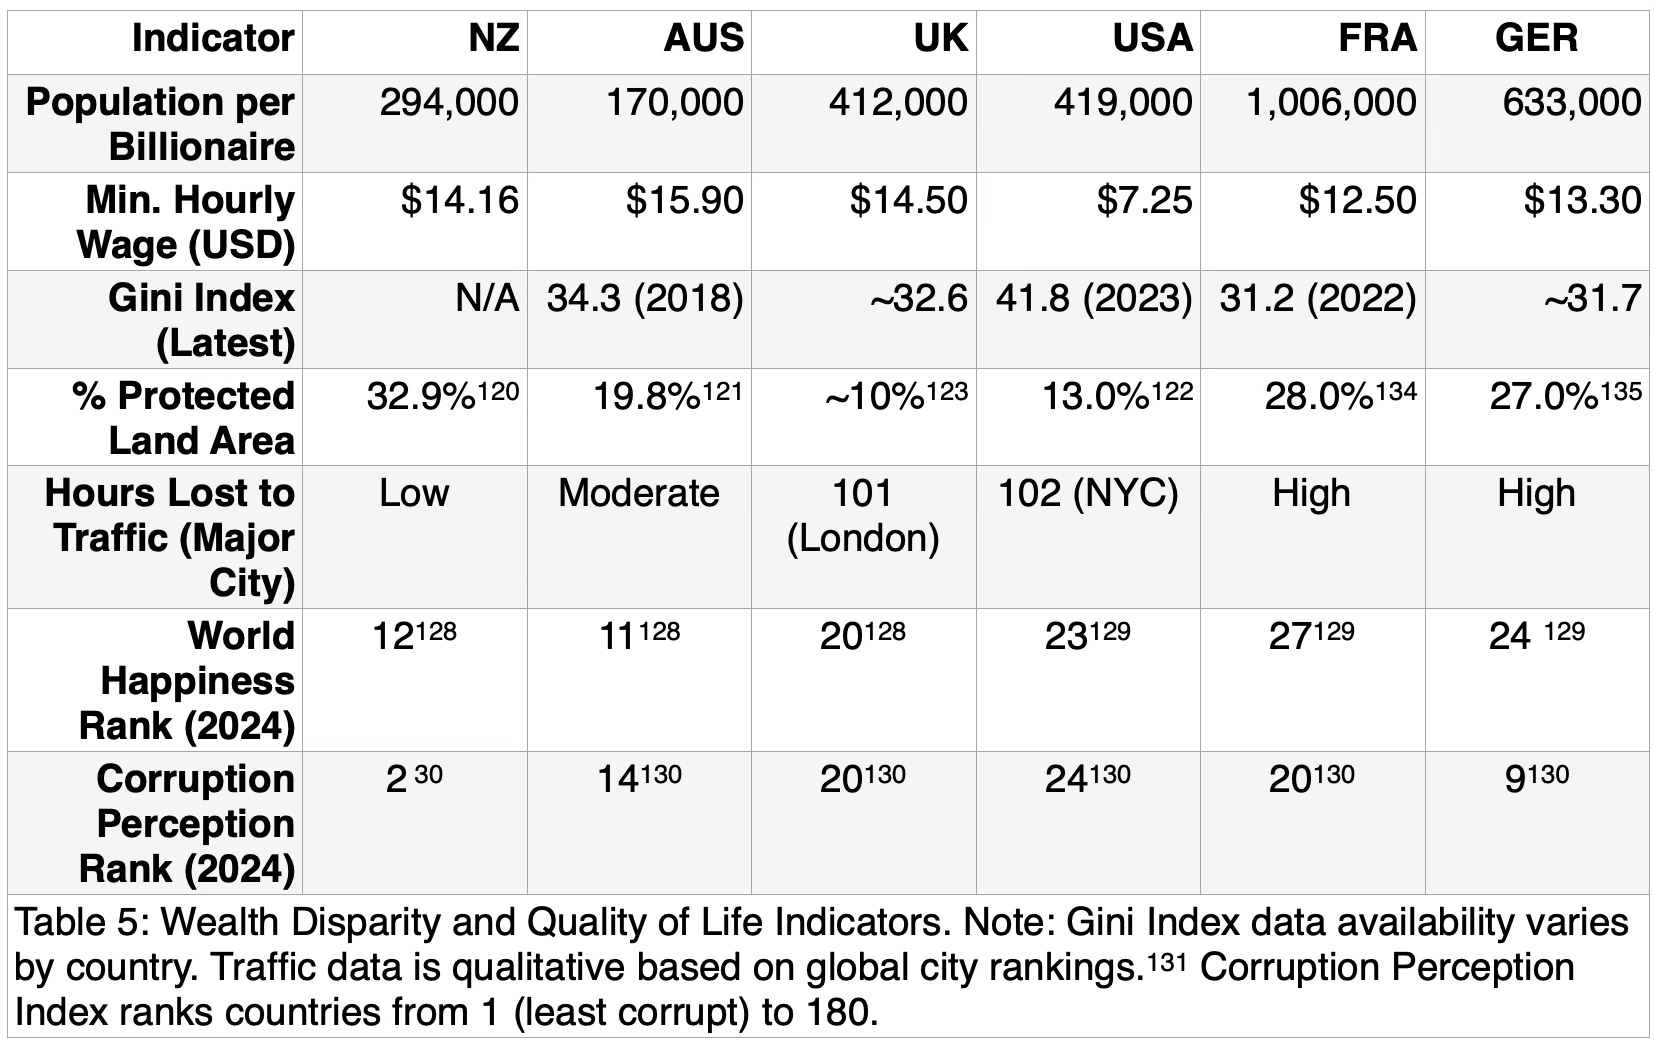
A key measure of societal equity is the distribution of wealth. An analysis of the extremes—billionaires and minimum wage earners—along with standardised inequality metrics, reveals a society more stratified than its egalitarian reputation might suggest.
In 2024, New Zealand was home to 18 billionaires98,99. For a population of 5.3 million, this equates to one billionaire for every 294,000 people. This concentration is notably higher than in most of the larger nations cited. Australia has one billionaire for every 170,000 people100, also a high concentration, while the UK has one per 412,000101, the USA one per 419,000102, Germany one per 633,000103, and France one per 1,006,000104. This suggests that smaller, developed economies may facilitate wealth concentration among a few dominant players or families.
At the other end of the spectrum, New Zealand‘s minimum wage of NZ$23.15 per hour105,106 (US$14.16) is robust, comparing favourably with the UK (£11.44 ~US$14.50)107,108 and surpassing the national minimums in France (€11.65/ ~US$12.50)111, Germany (€12.41/~US$13.30)112, and particularly the US federal minimum of US$7.25109,110. Australia‘s minimum wage of AU$24.10 ( US$15.90)113,114 is among the highest in the world.
The Gini index, a standard measure of income inequality where 0 is perfect equality and 100 is total inequality, confirms these disparities. The United States exhibits the highest inequality among the group with a Gini of 41.8115. Australia‘s most recent comprehensive figure is 34.3 116, while France (31.2)117 and Germany (~31.7)118 show more equitable distributions. While recent World Bank Gini data for New Zealand is sparse but domestic surveys reveal a stark picture of wealth distribution: in 2021, the top 10% of households held approximately 50% of the nation‘s total household net worth, while the bottom 50% held just 2.1%119. This indicates that while New Zealand provides a strong wage base, the concentration of wealth at the top remains a significant social and economic factor.
Counterbalancing the challenges of economic inequality are the quantifiable lifestyle dividends that stem directly from New Zealand‘s low population density and manageable societal scale. These advantages are a powerful draw for migrants and a source of national pride.
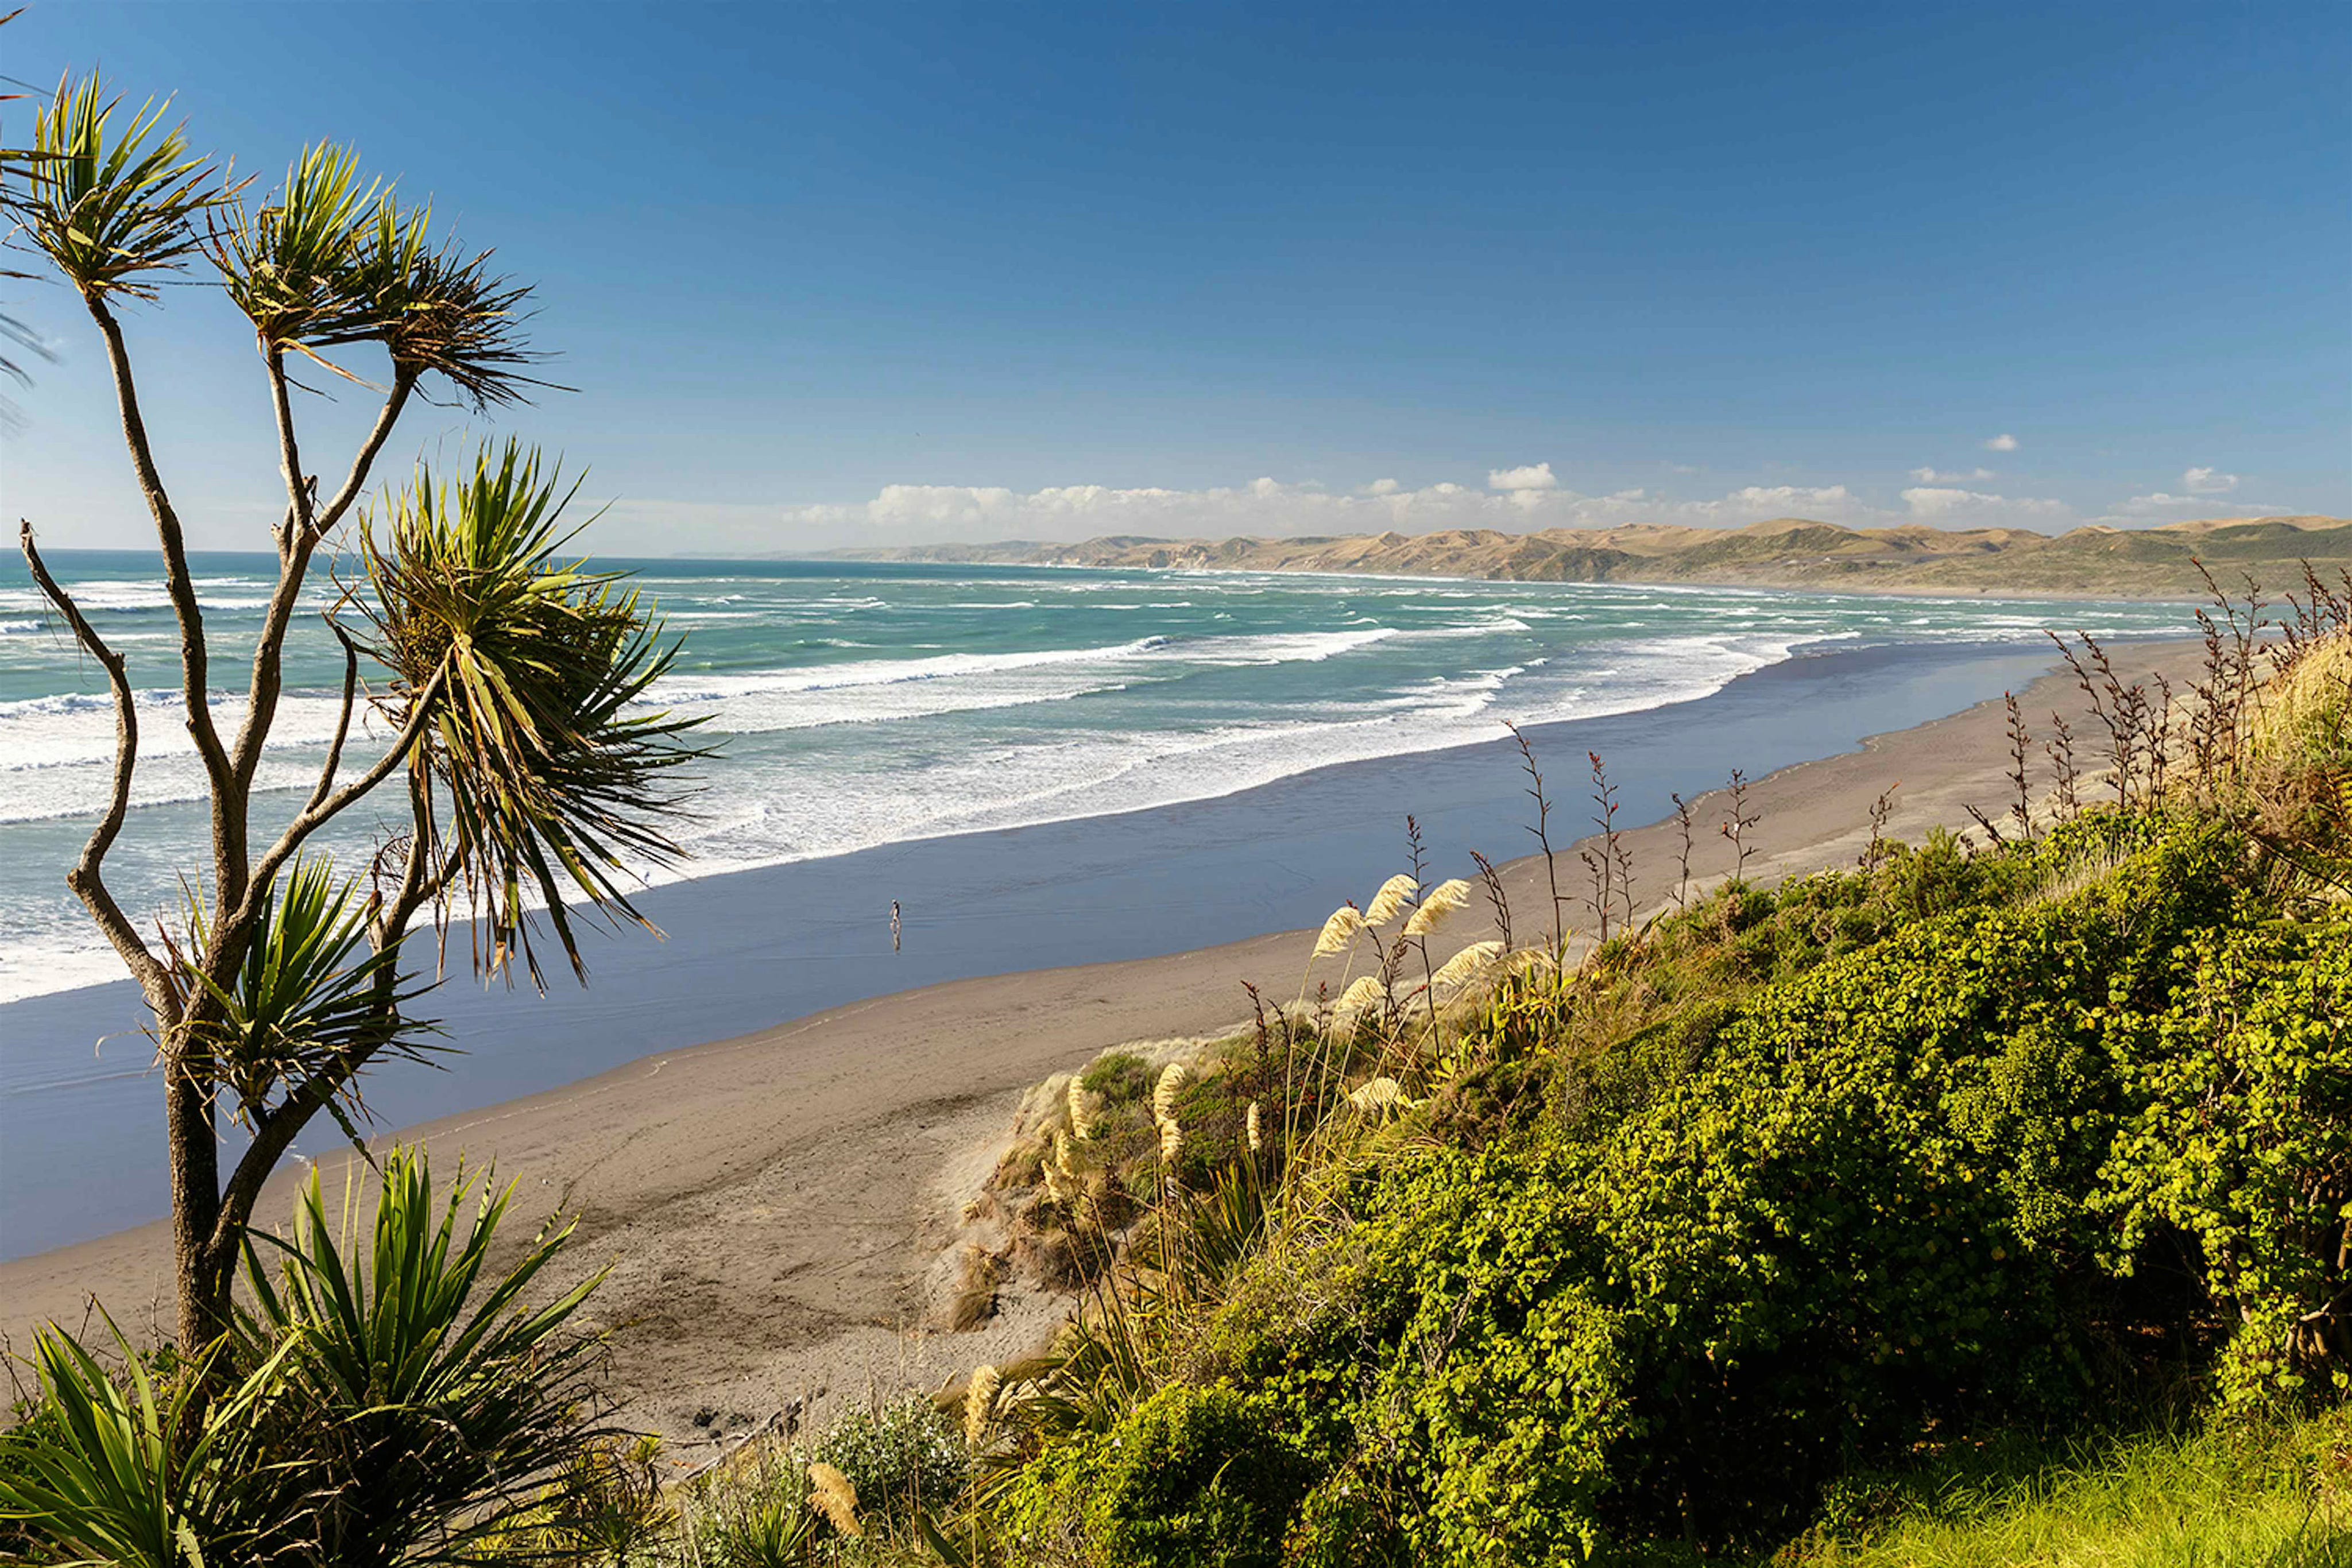
Access to Recreation and Nature: New Zealand has formally protected 32.9% of its terrestrial land area, providing its citizens with unparalleled access to national parks, forests, and coastlines120. This is a significantly higher proportion than in Australia (19.75%)121, the USA (13%)122, and the UK (where National Parks cover about 9.3% of England)123. This vast natural estate, combined with a 15,000 km coastline, offers abundant recreational opportunities that are easily accessible to most of the population124.
Low Urban Congestion: A direct benefit of a smaller population is reduced pressure on urban infrastructure. Traffic data from indices such as TomTom consistently show that New Zealand‘s major cities, Auckland and Wellington, experience far less traffic congestion than the megacities of the comparison nations125. For example, in 2024, drivers in New York and Chicago lost over 102 hours to traffic126, whereas residents of Australasian cities typically experience much lower delays127. This translates into tangible benefits: less time commuting, lower fuel costs, and reduced stress.
Social Cohesion and Quality of Life: New Zealand consistently performs at an elite level in global indices measuring social well-being and governance.
Happiness: The 2024 World Happiness Report ranked New Zealand 12th, ahead of the UK, USA (23rd), and Germany (24th)128,129.
Low Corruption: In the 2024 Corruption Perceptions Index, New Zealand ranked 2nd globally for its low levels of perceived public sector corruption, a testament to its high degree of institutional trust and transparency130. This is a significant advantage over the five nations used for a comparison131.
Work-Life Balance: One 2025 study ranked New Zealand first in the world for work-life balance, citing its generous statutory leave (32 days), paid maternity leave, and universal healthcare system—a stark contrast to the USA, which ranked 59th out of 60132.
These factors combine to create a powerful lifestyle proposition. However, recent reports also indicate fraying social cohesion, with concerns about poverty and political polarization that mirror trends in larger Western nations, suggesting that New Zealand is not immune to these global pressures133.
On the other side of the ledger are the clear and quantifiable advantages that arise directly from this same smallness. Low population density translates into tangible lifestyle dividends: world-leading access to natural and recreational spaces, minimal urban traffic congestion, and a greater sense of community. This manageable societal scale appears to foster a high degree of social trust and institutional integrity, as evidenced by New Zealand‘s consistently elite rankings for low corruption and its strong democratic norms. These factors culminate in an exceptionally high quality of life and a powerful, positive international brand. New Zealand is perceived globally as a safe, clean, and well-governed nation, a reputation it leverages effectively in its active role in international forums like the United Nations142,143.
However, this idyllic image is complicated by a notable level of wealth inequality. The concentration of billionaires relative to the population is high, and the share of wealth held by the top decile is substantial98,99. This suggests that the economic benefits of New Zealand‘s model are not distributed as evenly as its lifestyle advantages, creating a society that is simultaneously liveable but highly stratified.
The strategic imperative for New Zealand is to resolve this tension. It cannot compete with the United States or Germany on scale, nor can it eliminate the tyranny of distance138,139. Its path to greater prosperity lies in leveraging the very advantages of its smallness to mitigate the disadvantages. The nation‘s primary strategic asset is its brand: a reputation for quality, integrity, and wellbeing140,141.
The challenge is to convert this soft power into hard economic outcomes. This involves:
Attracting High-Value Capital and Talent: Using the high quality of life and stable government as a magnet for investment and skilled migration, not by competing on cost, but on quality and security.
Premium Exports: As an important producer of food (which must be sustained), developing more premium, high-value products intrinsically linked to New Zealand‘s clean, green, and trusted brand must be a priority.
Investing in Digital Connectivity: Continuing to build world-class digital infrastructure to make physical distance irrelevant for a growing number of service-based and knowledge-intensive industries.
Ultimately, New Zealand‘s small population is both its greatest liability and its most unique asset. The disadvantages in market scale and logistics are real and persistent but the corresponding advantages in lifestyle, governance, and national brand offer a platform for future prosperity. The nation‘s success will depend on its ability to strategically use the latter to overcome the former, turning a small nation into a unique global resource.
Gary Kerkin
August 2025
Works cited
rep.infometrics.co.nz, accessed on August 19, 2025, https://rep.infometrics.co.nz/new-zealand/population/growth
New Zealand - Economy - World Bank Open Data, accessed on August 19, 2025, https://data360.worldbank.org/en/economy/NZL
www.abs.gov.au, accessed on August 19, 2025, https://www.abs.gov.au/statistics/people/population
U.K. Population (1950-2025) - Macrotrends, accessed on August 19, 2025, https://www.macrotrends.net/global-metrics/countries/gbr/united-kingdom/population
tradingeconomics.com, accessed on August 19, 2025, https://tradingeconomics.com/france/population
German population sees slight growth in 2024 - IamExpat.de, accessed on August 19, 2025, https://www.iamexpat.de/expat-info/germany-news/german-population-sees-slight-growth-2024
tradingeconomics.com, accessed on August 19, 2025, https://tradingeconomics.com/united-states/population
New Zealand Population Density 1961-2025 | MacroTrends, accessed on August 19, 2025, https://macrotrends.net/global-metrics/countries/NZL/new-zealand/population-density
Population Density France 2024, accessed on August 19, 2025, https://www.populationpyramid.net/population-density/france/2024/
Countries by population density 2024 - StatisticsTimes.com, accessed on August 19, 2025, https://statisticstimes.com/demographics/countries-by-population-density.php
Population growth in the UK, accessed on August 19, 2025, https://populationmatters.org/population-growth-in-the-uk/
Australia‘s population June 2024. - Concept Australia, accessed on August 19, 2025, https://www.conceptaustralia.co.uk/news/story/Australia%E2%80%99s-population-June-2024./6488/
New Zealand GDP - Trading Economics, accessed on August 19, 2025, https://tradingeconomics.com/new-zealand/gdp
Australia GDP - Trading Economics, accessed on August 19, 2025, https://tradingeconomics.com/australia/gdp
Australia GDP 2024 Estimate and 2025 Projection - World Economics, accessed on August 19, 2025, https://www.worldeconomics.com/GrossDomesticProduct/Current-GDP/Australia.aspx
GDP (current US$) - United Kingdom - World Bank Data, accessed on August 19, 2025, https://data.worldbank.org/indicator/NY.GDP.MKTP.CD?locations=GB
France GDP - Trading Economics, accessed on August 19, 2025, https://tradingeconomics.com/france/gdp
France - World Bank Data, accessed on August 19, 2025, https://data.worldbank.org/country/france
Germany GDP - Trading Economics, accessed on August 19, 2025, https://tradingeconomics.com/germany/gdp
Germany - World Bank Data, accessed on August 19, 2025, https://data.worldbank.org/country/germany
United States - World Bank Data, accessed on August 19, 2025, https://data.worldbank.org/country/united-states
Gross Domestic Product Per Capita for Australia (PCAGDPAUA646NWDB) - FRED, accessed on August 19, 2025, https://fred.stlouisfed.org/series/PCAGDPAUA646NWDB
Census Bureau Profiles Results, accessed on August 19, 2025, https://data.census.gov/profile
US Census Bureau Highest Density, accessed on August 19, 2025, https://www.census.gov/popclock/embed.php?component=density
Cost of living in Index By Country in 2025: Clothing, Food, Housing & More - Wise, accessed on August 19, 2025, https://wise.com/gb/cost-of-living/index-by-country
Cost of Living City Ranking 2024 - Mercer, accessed on August 19, 2025, https://www.mercer.com/insights/total-rewards/talent-mobility-insights/cost-of-living/
Money and cost of living - korueducation, accessed on August 19, 2025, https://www.korueducation.co.nz/money-and-cost-of-living
Buy iPhone 16 and iPhone 16 Plus - Apple (NZ), accessed on August 19, 2025, https://www.apple.com/nz/shop/buy-iphone/iphone-16
Buy iPhone 16 128GB Black - Apple (AU), accessed on August 19, 2025, https://www.apple.com/au/shop/buy-iphone/iphone-16/6.1-inch-display-128gb-black
Buy iPhone 16 and iPhone 16 Plus - Apple (UK), accessed on August 19, 2025, https://www.apple.com/uk/shop/buy-iphone/iphone-16
iPhone - Apple, accessed on August 19, 2025, https://www.apple.com/iphone/
Acheter l‘iPhone 16 ou l‘iPhone 16 Plus - Apple (FR), accessed on August 19, 2025, https://www.apple.com/fr/shop/buy-iphone/iphone-16
Buy Apple iPhone 16 128GB White (MYE93ZD/A) - Bechtle AG, accessed on August 19, 2025, https://www.bechtle.com/de-en/shop/apple-iphone-16-128gb-white--4846763--p
Levis 501 Jeans - Red Streetwear, accessed on August 19, 2025, https://redstreetwear.co.nz/products/levis-501-jeans
Levi‘s Mens 501 Original Straight Fit Jeans (00501-0193) Medium Stonewash 32x32, accessed on August 19, 2025, https://www.allingtons.com.au/levis-mens-501-original-straight-fit-jeans-00501-0~4987595
Levis 501 mens • Compare (100+ products) see prices » - PriceRunner, accessed on August 19, 2025, https://www.pricerunner.com/sp/levis-501-mens.html
Levi‘s Men‘s 501 Jeans - Dave‘s New York, accessed on August 19, 2025, https://davesnewyork.com/collections/levis-mens-501-jeans
Men‘s 501® Original Jeans | Levi‘s® FR, accessed on August 19, 2025, https://www.levi.com/FR/en/clothing/men/jeans/501-original/c/levi_clothing_men_jeans_501_original
Men‘s 501® Jeans | Levi‘s® DE, accessed on August 19, 2025, https://www.levi.com/DE/en/clothing/men/jeans/c/levi_clothing_men_jeans/facets/feature-fit_name/501%C2%AE
How do NZ‘s butter prices stack up internationally? - 1News, accessed on August 19, 2025, https://www.1news.co.nz/2025/03/20/how-do-nzs-butter-prices-stack-up-internationally/
Yes, butter is expensive – but how does it compare to other countries? - DairyNews, accessed on August 19, 2025, https://dairynews.today/news/yes-butter-is-expensive-but-how-does-it-compare-to-other-countries.html
Sugar | PAK‘nSAVE Online, accessed on August 19, 2025, https://www.paknsave.co.nz/shop/category/pantry/baking-supplies--sugar/sugar?pg=1
Buy Coles White Sugar 1kg, accessed on August 19, 2025, https://www.coles.com.au/product/coles-white-sugar-1kg-5422530
Granulated Sugar 1Kg - Tesco Groceries, accessed on August 19, 2025, https://www.tesco.com/groceries/en-GB/products/252528422
White Sugar (1 kg) - Hampton Food Market, accessed on August 19, 2025, https://hamptonmarket.com/White-Sugar-1-kg-p657232511
France - Sugar - price, April 2025 | GlobalProductPrices.com, accessed on August 19, 2025, https://www.globalproductprices.com/France/sugar_prices/
www.globalproductprices.com, accessed on August 19, 2025, https://www.globalproductprices.com/germany/sugar_prices/#:~:text=The%20price%20of%20sugar%20in,uniform%20measure%20of%20one%20kilo.
New Zealand freight & supply chain issues paper, accessed on August 19, 2025, https://www.transport.govt.nz/assets/Uploads/Freight-and-supply-chain-issues-paper-A3-summary.pdf
Cost Analysis of Importing a Vehicle to New Zealand | Cars2NZ, accessed on August 19, 2025, https://www.cars2nz.com/blog/cost-of-importing-a-car-to-new-zealand
Global shipping costs are rising once again – July 2024, accessed on August 19, 2025, https://www.mfat.govt.nz/en/trade/mfat-market-reports/global-shipping-costs-are-rising-once-again-july-2024
Policy Brief Implications from the extent of vulnerabilities to national security from supply chain disruptions - The Treasury New Zealand, accessed on August 19, 2025, https://www.treasury.govt.nz/sites/default/files/2024-05/pc-inq-ier-sub-040-multi-agency-research-network-joint-submission.pdf
New Zealand freight & supply chain issues paper - Ministry of Transport, accessed on August 19, 2025, https://www.transport.govt.nz/assets/Uploads/Freight-and-supply-chain-issues-paper-full-version.pdf
The Prices of Goods and Services in New Zealand: An International Comparison, accessed on August 19, 2025, https://www.treasury.govt.nz/sites/default/files/2024-05/pc-wp-the-prices-of-goods-and-services-in-nz.pdf
New Zealand - Flash report, Automotive sales volume ranking, 2024 (By maker, vehicle type) - MarkLines, accessed on August 19, 2025, https://www.marklines.com/en/statistics/flash_sales/automotive-sales-in-newzealand-by-month-2024
Australia‘s best-selling cars, utes and SUVs for 2024 - RACV, accessed on August 19, 2025, https://www.racv.com.au/royalauto/transport/cars/australian-new-car-sales-2024.html
Hybrid boom: New car sales in 2024 | News | Open Road | The NRMA, accessed on August 19, 2025, https://www.mynrma.com.au/open-road/news/2025/car-sales-wrap-2024
New Zealand Tariff Rates | Historical Chart & Data - Macrotrends, accessed on August 19, 2025, https://www.macrotrends.net/global-metrics/countries/nzl/new-zealand/tariff-rates
Australia Tariff Rate: Applied: Weighted Mean: All Products | Economic Indicators - CEIC, accessed on August 19, 2025, https://www.ceicdata.com/en/australia/trade-tariffs/au-tariff-rate-applied-weighted-mean-all-products
State of U.S. Tariffs: July 28, 2025 - Yale Budget Lab, accessed on August 19, 2025, https://budgetlab.yale.edu/research/state-us-tariffs-july-28-2025
European Union Tariff Rates | Historical Chart & Data - Macrotrends, accessed on August 19, 2025, https://www.macrotrends.net/global-metrics/countries/euu/european-union/tariff-rates
List of countries by Internet connection speeds - Wikipedia, accessed on August 19, 2025, https://en.wikipedia.org/wiki/List_of_countries_by_Internet_connection_speeds
Prices of mobile communication services - Bakom.admin.ch, accessed on August 19, 2025, https://www.bakom.admin.ch/en/prices-of-mobile-communication-services
The Rural-Urban "Digital Divide" in New Zealand: Fact or Fable? - IDEAS/RePEc, accessed on August 19, 2025, https://ideas.repec.org/p/vuw/vuwcsr/19004.html
(PDF) The Rural-Urban ‘Digital Divide‘ in New Zealand: Fact or Fable? - ResearchGate, accessed on August 19, 2025, https://www.researchgate.net/publication/227623145_The_Rural-Urban_‘Digital_Divide‘_in_New_Zealand_Fact_or_Fable
New Zealand: Road Safety Country Profile 2023 - International Transport Forum (ITF), accessed on August 19, 2025, https://www.itf-oecd.org/sites/default/files/new-zealand-road-safety.pdf
Length of local roads and state highways in New Zealand regions ..., accessed on August 19, 2025, https://figure.nz/chart/bq2nITCfWrCUpWYy
Roads in the United Kingdom - Wikipedia, accessed on August 19, 2025, https://en.wikipedia.org/wiki/Roads_in_the_United_Kingdom
Road lengths in Great Britain: 2024 - GOV.UK, accessed on August 19, 2025, https://www.gov.uk/government/statistics/road-lengths-in-great-britain-2024/road-lengths-in-great-britain-2024
NLTF Report 2023/24 Section B: Detailed results - NZ Transport Agency Waka Kotahi, accessed on August 19, 2025, https://www.nzta.govt.nz/assets/resources/annual-report-nzta/2023-24/nltf-annual-report-2024-section-b.pdf
Australian Infrastructure Budget Monitor 2023-24, accessed on August 19, 2025, https://infrastructure.org.au/wp-content/uploads/2023/12/Australian-Infrastructure-Budget-Monitor-2023-24-1.pdf
Strategy | Supporting towns and regions to flourish - Te Waihanga, accessed on August 19, 2025, https://tewaihanga.govt.nz/the-strategy/6-a-thriving-new-zealand-what-we-need-to-do/6-2-supporting-towns-and-regions-to-flourish
Commission approves nearly $400m investment to strengthen grid, with Transpower to provide timing assurance on Cook Strait cable spend, accessed on August 19, 2025, https://comcom.govt.nz/news-and-media/news-and-events/2024/commission-approves-nearly-$400m-investment-to-strengthen-grid,-with-transpower-to-provide-timing-assurance-on-cook-strait-cable-spend
Commerce Commission approves Transpower‘s national grid plans | RNZ News, accessed on August 19, 2025, https://www.rnz.co.nz/news/business/510389/commerce-commission-approves-transpower-s-national-grid-plans
Magnetic Resonance Imaging (MRI) Machines per Million ..., accessed on August 19, 2025, https://www.commonwealthfund.org/international-health-policy-center/system-stats/mri-machines
New Zealand Doctors per 1,000 people - data, chart | TheGlobalEconomy.com, accessed on August 19, 2025, https://www.theglobaleconomy.com/New-Zealand/doctors_per_1000_people/
Doctors per 1,000 people in Australia/Oceania | TheGlobalEconomy.com, accessed on August 19, 2025, https://www.theglobaleconomy.com/rankings/doctors_per_1000_people/Australia/
United Kingdom Doctors per 1,000 people - data, chart | TheGlobalEconomy.com, accessed on August 19, 2025, https://www.theglobaleconomy.com/United-Kingdom/doctors_per_1000_people/
Infographic: The Countries With The Highest Density Of Doctors - Statista, accessed on August 19, 2025, https://www.statista.com/chart/21168/doctors-per-1000-inhabitants-in-selected-countries/
France Doctors per 1,000 people - data, chart | TheGlobalEconomy.com, accessed on August 19, 2025, https://www.theglobaleconomy.com/France/doctors_per_1000_people/
Germany Doctors per 1,000 people - data, chart | TheGlobalEconomy.com, accessed on August 19, 2025, https://www.theglobaleconomy.com/Germany/doctors_per_1000_people/
Australia | Road Traffic Data - xMap AI, accessed on August 19, 2025, https://www.xmap.ai/data-catalogs/australia-road-traffic-data
List of countries by road network size - Wikipedia, accessed on August 19, 2025, https://en.wikipedia.org/wiki/List_of_countries_by_road_network_size
France | Road Traffic Data - xMap AI, accessed on August 19, 2025, https://www.xmap.ai/data-catalogs/france-road-traffic-data
New Zealand Medical Doctors - Trading Economics, accessed on August 19, 2025, https://tradingeconomics.com/new-zealand/medical-doctors
France - Physicians - 2025 Data 2026 Forecast 1970-2021 Historical - Trading Economics, accessed on August 19, 2025, https://tradingeconomics.com/france/physicians-per-1-000-people-wb-data.html
Germany DE: Physicians: per 1000 People | Economic Indicators - CEIC, accessed on August 19, 2025, https://www.ceicdata.com/en/germany/social-health-statistics/de-physicians-per-1000-people
Tax rates for individuals - Inland Revenue, accessed on August 19, 2025, https://www.ird.govt.nz/income-tax/income-tax-for-individuals/tax-codes-and-tax-rates-for-individuals/tax-rates-for-individuals
Income tax - Moneysmart.gov.au, accessed on August 19, 2025, https://moneysmart.gov.au/work-and-tax/income-tax
commonslibrary.parliament.uk, accessed on August 19, 2025, https://commonslibrary.parliament.uk/research-briefings/cbp-9993/#:~:text=Income%20tax%20on%20earned%20income,limit%2C%20set%20at%20%C2%A337%2C700.
2024 Tax Brackets | 2024-2025 Federal Tax Brackets & Rates, accessed on August 19, 2025, https://taxfoundation.org/data/all/federal/2024-tax-brackets/
Navigating French Taxes In 2024: What Expats Need To Know, accessed on August 19, 2025, https://www.blacktowerfm.com/news/french-taxes/
The Tax Levels in Germany explained - Expatrio, accessed on August 19, 2025, https://www.expatrio.com/about-germany/german-tax-system
Fuel excise explained - Australian Automobile Association, accessed on August 19, 2025, https://www.aaa.asn.au/advocacy/explainers/fuel-excise-explained/
Vehicle excise duty - Office for Budget Responsibility - OBR, accessed on August 19, 2025, https://obr.uk/forecasts-in-depth/tax-by-tax-spend-by-spend/vehicle-excise-duty-2/
Motor Fuel Data - Policy - Federal Highway Administration - Department of Transportation, accessed on August 19, 2025, https://www.fhwa.dot.gov/policyinformation/motorfueldata.cfm
Fiscalité et voiture de société : 5 choses à retenir - Mooncard, accessed on August 19, 2025, https://www.mooncard.co/fr/cas-usage/flotte-auto/voiture-de-societe/fiscalite
Kraftfahrzeugsteuer - Zoll online, accessed on August 19, 2025, https://www.zoll.de/DE/Privatpersonen/Kraftfahrzeugsteuer/kraftfahrzeugsteuer_node.html
New Zealand Rich List exceeds $100 billion amid cost-of-living crisis - WSWS, accessed on August 19, 2025, https://www.wsws.org/en/articles/2025/06/16/srty-j16.html
NZ‘s richest pass $100 billion mark in latest rich list, while average Kiwis lose wealth, accessed on August 19, 2025, https://m.economictimes.com/news/international/new-zealand/nzs-richest-pass-100-billion-mark-in-latest-rich-list-while-average-kiwis-lose-wealth/articleshow/121722986.cms
Gina Rinehart tops Financial Review Rich List for sixth consecutive year as number of billionaires soar - Nine for Brands, accessed on August 19, 2025, https://www.nineforbrands.com.au/media-release/gina-rinehart-tops-financial-review-rich-list-for-sixth-consecutive-year-as-number-of-billionaires-soar/
UK‘s 50 richest families hold more wealth than 50% of population, analysis finds | The super-rich | The Guardian, accessed on August 19, 2025, https://www.theguardian.com/news/2025/may/19/uk-50-richest-families-hold-more-wealth-than-50-of-population-analysis-finds
2024 Billionaire Round-Up - Inequality.org, accessed on August 19, 2025, https://inequality.org/article/2024-billionaire-round-up/
Charted: Which Country Has the Most Billionaires in 2024? - Visual Capitalist, accessed on August 19, 2025, https://www.visualcapitalist.com/charted-which-country-has-the-most-billionaires-in-2024/
Top 10 countries with the most billionaires in 2024—India ranks third globally, accessed on August 19, 2025, https://indianexpress.com/article/trending/top-10-listing/top-10-countries-with-the-most-billionaires-in-2024-9495796/
Minimum wage reviews | Ministry of Business, Innovation & Employment, accessed on August 19, 2025, https://www.mbie.govt.nz/business-and-employment/employment-and-skills/employment-legislation-reviews/minimum-wage-reviews
Minimum wage rising to $23.15 per hour from 1 April 2024, accessed on August 19, 2025, https://www.mbie.govt.nz/about/news/minimum-wage-rising-to-23-15-per-hour-from-1-april-2024
National Minimum Wage statistics - The House of Commons Library, accessed on August 19, 2025, https://commonslibrary.parliament.uk/research-briefings/cbp-7735/
www.personio.com, accessed on August 19, 2025, https://www.personio.com/hr-lexicon/uk-minimum-wage/#:~:text=From%201%20April%202024%20onward,by%20more%20than%20%C2%A31.
Minimum wage in the United States - Wikipedia, accessed on August 19, 2025, https://en.wikipedia.org/wiki/Minimum_wage_in_the_United_States
en.wikipedia.org, accessed on August 19, 2025, https://en.wikipedia.org/wiki/Minimum_wage_in_the_United_States#:~:text=From%20September%201%2C%201997%2C%20through,remained%20fixed%20as%20of%202024.
www.welcometofrance.com, accessed on August 19, 2025, https://www.welcometofrance.com/en/increase-of-the-minimum-wage-smic-on-january-1-2024
Customs online - Minimum pay pursuant to the Minimum Wage Act - Zoll, accessed on August 19, 2025, https://www.zoll.de/EN/Businesses/Work/Foreign-domiciled-employers-posting/Minimum-conditions-of-employment/Minimum-pay-pursuant-Minimum-Wage-Act/minimum-pay-pursuant-minimum-wage-act_node.html
Changes for businesses from 1 July 2024 | business.gov.au, accessed on August 19, 2025, https://business.gov.au/news/changes-for-businesses-from-1-july-2024
Minimum wages increase from 1 July 2024 - Fair Work Ombudsman, accessed on August 19, 2025, https://www.fairwork.gov.au/newsroom/news/minimum-wages-increase-1-july-2024
GINI Index for the United States (SIPOVGINIUSA) | FRED | St. Louis Fed, accessed on August 19, 2025, https://fred.stlouisfed.org/series/SIPOVGINIUSA
Australia Gini inequality index - data, chart | TheGlobalEconomy.com, accessed on August 19, 2025, https://www.theglobaleconomy.com/Australia/gini_inequality_index/
GINI Index for France (SIPOVGINIFRA) | FRED - Federal Reserve Bank of St. Louis, accessed on August 19, 2025, https://fred.stlouisfed.org/series/SIPOVGINIFRA
Gini Index | Germany | 1991-2019 | World Bank - Indicators - My Data Jungle, accessed on August 19, 2025, https://www.mydatajungle.com/indicators/?cat=7&indicator=37&country=3&period=1A&source=16&from=1991-12-01&to=2019-12-01
Distribution of wealth across New Zealand households remains unchanged between 2015 and 2021 | Stats NZ, accessed on August 19, 2025, https://www.stats.govt.nz/news/distribution-of-wealth-across-new-zealand-households-remains-unchanged-between-2015-and-2021/
Protected Areas Network » Maps » - Our Environment, accessed on August 19, 2025, https://ourenvironment.scinfo.org.nz/maps-and-tools/app/Habitats/lenz_prot_areas
Protected areas of Australia - Wikipedia, accessed on August 19, 2025, https://en.wikipedia.org/wiki/Protected_areas_of_Australia
www.transect.com, accessed on August 19, 2025, https://www.transect.com/insights/protected-areas
Key Facts and Figures for all 15 UK National Parks, accessed on August 19, 2025, https://www.nationalparks.uk/app/uploads/2020/10/Key-Facts-and-Figures-for-the-15-UK-National-Parks.pdf
www.doc.govt.nz, accessed on August 19, 2025, https://www.doc.govt.nz/documents/science-and-technical/docts10.pdf
Annual TomTom Traffic Index: Unveiling data-driven insights from over 450 billion miles driven in 2024 - Press Release Detail Page | TomTom Newsroom, accessed on August 19, 2025, https://www.tomtom.com/newsroom/press-releases/general/605041959/tomtom-traffic-index-2025/
TomTom Traffic Index – Live traffic statistics and historical data, accessed on August 19, 2025, https://www.tomtom.com/traffic-index/
INRIX 2024 Global Traffic Scorecard: Employees & Consumers Returned to Downtowns, Traffic Delays & Costs Grew, accessed on August 19, 2025, https://inrix.com/press-releases/2024-global-traffic-scorecard-us/
Rankings - WHR Dashboard - World Happiness Report, accessed on August 19, 2025, https://data.worldhappiness.report/table
World‘s Happiest Countries 2024: Surprising Trends and Key Takeaways, accessed on August 19, 2025, https://placebrandobserver.com/world-happiest-countries-2024/
2024 Corruption Perceptions Index: Corruption is playing a devastating role in the climate crisis - Transparency International, accessed on August 19, 2025, https://www.transparency.org/en/press/2024-corruption-perceptions-index-corruption-playing-devastating-role-climate-crisis
New Zealand - Country Performance, Brand Strength, Reputation, accessed on August 19, 2025, https://placebrandobserver.com/new-zealand-country-performance-brand-strength-reputation/
20 Best Countries For Work-Life Balance—And U.S. Isn‘t On It - Newsweek, accessed on August 19, 2025, https://www.newsweek.com/20-best-countries-work-life-balace-2096102
Report sheds light on social cohesion in New Zealand - 1News, accessed on August 19, 2025, https://www.1news.co.nz/2025/03/31/report-sheds-light-on-social-cohesion-in-new-zealand/
France | Biodiversity Information System for Europe - European Union, accessed on August 19, 2025, https://biodiversity.europa.eu/countries/france
List of nature parks in Germany - Wikipedia, accessed on August 19, 2025, https://en.wikipedia.org/wiki/List_of_nature_parks_in_Germany
New Zealand‘s Productivity Challenge - International Monetary Fund (IMF), accessed on August 19, 2025, https://www.imf.org/en/Publications/selected-issues-papers/Issues/2025/06/09/New-Zealand-s-Productivity-Challenge-New-Zealand-567560
New Zealand‘s Productivity Challenge - IMF eLibrary, accessed on August 19, 2025, https://www.elibrary.imf.org/downloadpdf/view/journals/018/2025/075/018.2025.issue-075-en.pdf
Firm Dynamics in New Zealand: A Comparative Analysis with OECD Countries (WP 04/11), accessed on August 19, 2025, https://www.treasury.govt.nz/publications/wp/firm-dynamics-new-zealand-comparative-analysis-oecd-countries-wp-04-11
PDF File - Working Paper 03-03 - Geography, Trade and Growth: Problems and Possibilities for the New Zealand Economy, accessed on August 19, 2025, https://www.treasury.govt.nz/sites/default/files/2007-09/twp03-03.pdf
Life in New Zealand, accessed on August 19, 2025, https://www.immigration.govt.nz/live/moving-to-new-zealand/life-in-new-zealand/
NZStory_Infographic_808604_Brand Finance_Overall - New Zealand Story Toolkit, accessed on August 19, 2025, https://toolkit.nzstory.govt.nz/asset-page/668858-nzstory_infographic_808604_brand-finance_overall
NZ and the UN - United Nations Association of New Zealand, accessed on August 19, 2025, https://www.unanz.org.nz/learn/nz-and-the-un/
New Zealand and the United Nations - Wikipedia, accessed on August 19, 2025, https://en.wikipedia.org/wiki/New_Zealand_and_the_United_Nations
Australian government debt in historical and international perspective - Parliament of Australia, accessed on August 19, 2025, https://www.aph.gov.au/About_Parliament/Parliamentary_departments/Parliamentary_Library/Research/Briefing_Book/47th_Parliament/AustralianGovernmentDebt
The fiscal policy response to the pandemic - Brookings Institution, accessed on August 19, 2025, https://www.brookings.edu/articles/the-fiscal-policy-response-to-the-pandemic/
Public Debt | IMF Annual Report 2023, accessed on August 19, 2025, https://www.imf.org/external/pubs/ft/ar/2023/in-focus/public-debt/
GLOBAL DEBT MONITOR 2024 - International Monetary Fund (IMF), accessed on August 19, 2025, https://www.imf.org/external/datamapper/GDD/2024%20Global%20Debt%20Monitor.pdf
Treasury briefing points finger at government spending during Covid-19 pandemic - RNZ, accessed on August 19, 2025, https://www.rnz.co.nz/news/business/569336/treasury-briefing-points-finger-at-government-spending-during-covid-19-pandemic
Government finance statistics (general government): Year ended June 2024 - Stats NZ, accessed on August 19, 2025, https://www.stats.govt.nz/information-releases/government-finance-statistics-general-government-year-ended-june-2024/
Australian government debt - Wikipedia, accessed on August 19, 2025, https://en.wikipedia.org/wiki/Australian_government_debt
Net Debt (excluding public sector banks) as a % of GDP: NSA - Office for National Statistics, accessed on August 19, 2025, https://www.ons.gov.uk/economy/governmentpublicsectorandtaxes/publicsectorfinance/timeseries/hf6x/pusf
U.S. Debt to GDP Ratio | Historical Chart & Data - Macrotrends, accessed on August 19, 2025, https://www.macrotrends.net/global-metrics/countries/usa/united-states/debt-to-gdp-ratio
In 2023, the public deficit reached 5.5 % of GDP, the public debt 110.6 % of GDP - Insee, accessed on August 19, 2025, https://www.insee.fr/en/statistiques/8063157
General government gross debt for France (GGGDTAFRA188N) | FRED | St. Louis Fed, accessed on August 19, 2025, https://fred.stlouisfed.org/series/GGGDTAFRA188N
German general government debt up in 2023 by €62 billion to €2.62 trillion, debt ratio down from 66.1% to 63.7% | Deutsche Bundesbank, accessed on August 19, 2025, https://www.bundesbank.de/en/press/press-releases/deutsche-staatsschulden-928556
The budget deficit: a short guide - The House of Commons Library, accessed on August 19, 2025, https://commonslibrary.parliament.uk/research-briefings/sn06167/
Our National Debt - Peterson Foundation, accessed on August 19, 2025, https://www.pgpf.org/our-national-debt/
First published on Substack 24 August 2025.
You must be logged in to post a comment